
Int J Chem Res, Vol 10, Issue 2, 1-5Review Article
FAST PROTEIN STRUCTURAL ASSESSMENT USING CIRCULAR DICHROISM (CD) SPECTROSCOPY: AN UPDATED REVIEW
ASHISH SAMBHAJI UZGARE*
Department of Chemistry, Faculty of Science, Wilson College (Autonomous), Mumbai-400007, Maharashtra, India
*Corresponding author: Ashish Sambhaji Uzgare; *Email: [email protected]
Received: 09 Dec 2025 Revised and Accepted: 24 Jan 2026
ABSTRACT
Circular dichroism (CD) spectroscopy has become a rapid and versatile analytical technique for probing protein structure, playing a pivotal role in modern proteomics and structural genomics. This review integrates studies published between 1994-2025 to examine the principles, instrumentation, and diverse applications of CD spectroscopy. CD measures the differential absorption of left-and right-circularly polarized light by chiral molecules, enabling semi-quantitative estimation of protein secondary structures such as α-helices, β-sheets, and random coils using far-UV spectra, and providing insights into tertiary environments via near-UV signals. Its applications include monitoring protein folding and unfolding, characterizing intrinsically disordered proteins (IDPs), and assessing structural integrity in recombinant proteins and biopharmaceuticals. The combination of experimental CD data with computational tools, including vibrational CD (VCD) simulations, the BeStSel algorithm, and machine learning approaches, has improved accuracy, particularly for β-rich, flexible, or disordered protein systems. Despite limitations, such as the need for high-purity samples and approximate secondary structure estimation, CD’s minimal sample requirement, rapid data acquisition, and solution-based analysis make it an essential tool for initial structural evaluation. Looking forward, advances in computational integration, standardized reference databases, and expanded applications to dynamic protein complexes and challenging biomolecules promise to further enhance CD spectroscopy as a cornerstone technique in structural biology and biotechnology.
Keywords: Protein, Secondary structure, Tertiary structure, Spectroscopy
© 2026 The Authors. Published by Innovare Academic Sciences Pvt Ltd. This is an open access article under the CC BY license (http://creativecommons.org/licenses/by/4.0/)
DOI: http://dx.doi.org/10.22159/ijcr.2026v10i2.331 Journal homepage: https://ijcr.info/index.php/journal
INTRODUCTION
Proteins play crucial roles in numerous biological processes. Isolating proteins in a pure and functional form is an important prerequisite for uses including therapeutic development and structural characterization [1]. Rapid analysis of newly identified proteins is crucial in both proteomics and structural genomics. Circular dichroism (CD) offers a powerful and efficient approach for examining protein secondary structure, overall folding, and binding interactions [2]. It also provides valuable information on molecular chirality and is extensively employed for analyzing protein secondary structures [3]. Proteins contain chiral subunits that produce characteristic signals when illuminated with circularly polarised light in the UV range. Circular dichroism (CD) spectroscopy measures the differential absorption of left-and right-circularly polarised light, enabling the analysis of protein conformations. It is widely used to determine secondary structure from far-UV signals (∼240–170 nm) and to probe tertiary environments of aromatic residues in the near-UV region (∼300–260 nm), reflecting changes in conditions, amino acid composition, or interactions [4, 5]. CD spectroscopy finds applications in a variety of scientific areas. Far-UV CD is mainly used to assess the secondary structure of proteins. UV/Vis CD helps study charge-transfer transitions, whereas near-infrared CD probes the geometric and electronic structures through metal d→d transitions. Vibrational circular dichroism (VCD), utilizing infrared light, is applied to structural analysis of small organic molecules as well as proteins and DNA [6, 7].
This review analyzes studies published between 1994-2025, drawing on data from Scopus, ResearchGate, Google Scholar, and DAOJ. It aims to highlight Circular Dichroism (CD) spectroscopy as a rapid and versatile analytical tool for studying protein structure. The review focuses on the principles, applications, and advantages of CD in evaluating protein secondary and tertiary structures while also addressing its broader use in the structural analysis of proteins, small molecules, and nucleic acids.
Principles and instrumentation of circular dichroism (CD) spectroscopy
CD spectroscopy measures how circularly polarized light interacts with chiral molecules. Linearly polarized light is made up of equal left-and right-circular components, which are absorbed differently by chiral samples, making the transmitted light elliptically polarized. This ellipticity (θ) is measured across wavelengths and can be expressed as molar ellipticity ([θ]) or molar dichroic absorption (Δε) for analysis [4, 8, 9].
The instrumentation of Circular Dichroism (CD) spectroscopy is designed to measure the differential absorption of left-and right-circularly polarized light by chiral molecules. A typical CD spectrometer consists of the following components: fig. 1 shows Instrumentation of Circular Dichroism (CD).
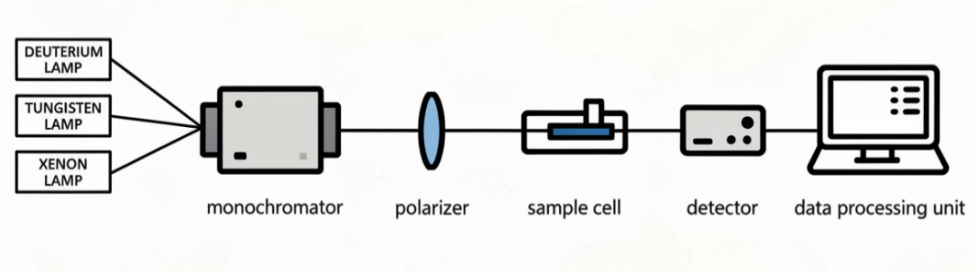
Fig. 1: Instrumentation of circular dichroism (CD)
Light source
Provides a continuous spectrum of ultraviolet (UV) or visible light suitable for the sample being studied. Commonly used sources include deuterium lamps for the far-UV range (180–250 nm) and tungsten lamps for the near-UV or visible range (250–800 nm) [10].
Monochromator
Selects a specific wavelength from the light source, enabling the instrument to scan across a desired wavelength range and record the CD spectrum [11].
Polarizer
Transforms unpolarized light into linearly polarized light, preparing it for conversion into circularly polarized light [10, 11].
Sample cell
Typically a quartz cuvette transparent to UV light. The path length generally ranges from 0.01 to 1 cm, depending on the absorbance of the sample [10, 11].
Detector
Measures the intensity of light transmitted through the sample and records the difference in absorption between left-and right-circularly polarized light [10].
Data processing unit
Processes the detector signals into a CD spectrum, usually expressed as ellipticity (millidegrees) or molar ellipticity, and enables analysis of molecular structures, conformational changes, and other chiroptical properties [10].
Protein structure prediction using circular dichroism (CD) spectroscopy
Circular dichroism (CD) spectroscopy provides a rapid and flexible approach for examining protein and peptide higher-order structures. Far-UV CD facilitates quantitative analysis of secondary structures, while near-UV CD delivers detailed information on tertiary arrangements. Advances in recombinant protein expression have made CD spectroscopy a common method for characterizing newly produced proteins [12]. Linhares and Ramos, 2023 highlight circular dichroism (CD) spectroscopy as a versatile tool for studying protein folding, structure, and function. CD requires minimal sample amounts, monitors conformational changes under varying conditions, and is enhanced by synchrotron radiation (SRCD) and solid-state CD (SSCD) for challenging proteins. These features make CD valuable in drug discovery, protein engineering, and biotechnology [13]. Sun et al., 1998 showed that oligonucleotides can form various DNA structures, such as duplexes, triplexes, and quadruplexes, each with distinct circular dichroism (CD) spectra. While all structures share a negative band around 240 nm, their spectra from 260–300 nm differ due to factors like chain orientation, sugar puckering, glycosyl bond angles, base stacking, and sequence. Analyzing these spectral differences provides insights into oligonucleotide conformations, facilitates the prediction of new structures, and supports investigations into their potential biological roles [14]. Keiderling et al., 1994 demonstrated that vibrational circular dichroism (VCD) is highly sensitive to protein secondary structure and can track structural changes under varying conditions, including pH, denaturation, Ca²⁺ presence, and solvent effects. Using α-lactalbumin (LA) and lysozyme as models, they found species-and condition-dependent differences in VCD, UV electronic CD, and FTIR spectra. Notably, LA in its low-pH molten globule form shows reduced tertiary structure and more similar spectra across species, while native LA exhibits greater structural flexibility than lysozyme. These dynamic structural variations, particularly in helical regions, may influence biological function, such as LA’s interaction with β-galactosyl transferase in lactose synthetase formation [15]. Datta and Swamy, 2017 used circular dichroism (CD) to show that MLGL (Mulberry Latex Galactose-specific Lectin) maintains its secondary and tertiary structures up to 70 °C, reflecting high thermal stability. The lectin’s secondary structure also remained stable across pH 6.2–8.5, although lectin activity decreased by ~50% at pH 6.2. These findings confirm that MLGL preserves its structural integrity under a broad range of temperatures and near-neutral pH [16]. Sangeeta and Pathania, 2021 highlight circular dichroism (CD) as a powerful tool for analyzing protein higher-order structures, thermal stability, folding, and ligand interactions. CD employs circularly polarized light to probe the structural properties of chiral biomolecules, allowing quantitative monitoring of protein denaturation, conformational changes, and protein-ligand binding under physiological conditions. Its advantages include requiring only small sample amounts and providing rapid insight into structural changes due to environmental factors. The technique is widely used in studies of recombinant proteins, nucleic acids, and their interactions with metals or other compounds. The authors also emphasize that careful experimental design, instrument calibration, and sample characterization are essential to obtain reliable and interpretable CD data [17]. Honisch et al., 2020 investigated the photostability of water-soluble lens crystallins, whose aggregation leads to cataract formation. Using circular dichroism (CD), fluorescence, and synchrotron radiation CD, along with complementary techniques such as dynamic light scattering, electron microscopy, and LC–MS/MS, they showed that UV exposure disrupts protein conformation, reduces structural order, and promotes aggregation. These effects were linked to the generation of reactive oxygen species. The study provides a framework for high-throughput screening of compounds that could prevent protein denaturation and aggregation in the eye lens [18]. Hall et al., 2014 developed a self-organizing map (SSNN) to predict protein secondary structure from circular dichroism (CD) spectra, even when protein concentrations are uncertain. By analyzing the normalized root mean square deviation between predicted and experimental spectra against a concentration scaling factor, they could refine both concentration estimates and secondary structure assignments. The method showed reliable results for NRMSD<0.03 and reasonable predictions for NRMSD<0.05, with improved accuracy achieved by augmenting the database with fully helical and random coil spectra [19].
Advancing protein structure analysis through circular dichroism and computational techniques
Circular dichroism (CD) spectroscopy provides a rapid, non-destructive method to examine protein secondary and tertiary structures, including folding and stability under various conditions. Integrating CD data with computational analyses, such as molecular modeling and β-structure prediction algorithms, enhances the accuracy of structural interpretations. This combined approach is particularly useful for complex proteins, aggregates, and amyloid fibrils, where conventional CD may be insufficient. By bridging experimental and computational insights, researchers can better understand protein structure-function relationships and guide therapeutic protein design [4].
Micsonai et al., 2015 highlighted circular dichroism (CD) spectroscopy as a key method for studying protein structure, while noting that conventional algorithms often struggle with α/β-mixed or β-rich proteins due to the spectral diversity of β-sheets. They developed the best sel method, which accounts for the twist and orientation of β-sheets, enabling accurate distinction between parallel and antiparallel β-sheets and reliable secondary structure estimation across a wide range of proteins. Best sel also allows prediction of protein folds according to CATH topology from a single CD spectrum. The method is particularly valuable when X-ray or NMR approaches are unsuitable and can be applied to both conventional and synchrotron radiation CD (SRCD) data, including studies of amyloid fibrils from disease-related proteins and peptides [20].
Eikås et al., 2022 developed a computational protocol for accurately calculating vibrational circular dichroism (VCD) spectra of flexible cyclic oligopeptides, which are promising candidates for next-generation antibiotics. Their three-step approach uses CREST for conformational sampling, B3LYP/6-31+G/CPCM for geometry optimization and VCD calculations of low-energy conformers, and Boltzmann weighting to generate spectra. This method allows reliable stereochemical assignment and can be applied to larger cyclic peptides, facilitating the study of biologically and pharmaceutically relevant compounds [21].
Rogers et al., 2022 highlight that circular dichroism (CD) spectroscopy is a key method for probing biomolecular structure. They improve first-principles CD calculations by applying a diabatisation approach to better capture nearest-neighbour interactions between nπ* and πnbπ* transitions in peptide bonds. Incorporating these refinements into the exciton-based tool Dichro Calc enhances its accuracy, especially for predicting CD spectra of α-helical structures [22].
Uporovet al., 2015 introduce DInaMo, a computational package designed to calculate protein circular dichroism (CD) spectra using classical electromagnetic theory. The tool provides an alternative to traditional quantum-based methods by modeling how proteins interact with circularly polarized light. Developed through a collaborative effort across multiple institutions, DInaMo offers a practical approach for predicting CD responses and supporting structural analysis in biochemical research [23].
Jasim et al., 2018 highlight that accurately linking protein structure to optical spectroscopy remains challenging, especially for near-UV circular dichroism (CD). Their DichroCalc web server computes CD spectra from first principles, but near-UV signals originating from aromatic side chainsare difficult to model. By incorporating vibrational features of these electronic transitions, the authors improve near-UV CD predictions. Testing across diverse proteins, including bovine pancreatic trypsin inhibitor, shows clearer insight into the interactions that shape near-UV CD spectra [24].
Janes, 2005 reports that although CD spectroscopy is a powerful method for estimating protein secondary structure, the reference databases it depends on have notable shortcomings. CD spectra for the same protein often vary between laboratories, and many databases combine these inconsistent datasets. Some X-ray structures used as references also fail modern validation standards, making their derived secondary structure values unreliable. Because current databases do not fully represent the diversity of protein structures, Janes argues that a new, standardized, and validated CD reference database is needed [25].
Zhao et al., 2021 developed a machine learning approach to predict protein circular dichroism (CD) spectra, replacing standard geometry-based descriptors with embedded density descriptors. This method accurately predicts electric and magnetic transition dipole moments, achieving results comparable to first-principles calculations. The model simulates CD spectra nearly 10,000 times faster than conventional methods while maintaining good agreement with experimental data [26].
Matsuo et al., 2007 used VUVCD spectra and the SELCON3 computational program, alongside Protein Data Bank reference data, to estimate the secondary structure content of denatured proteins. Their analysis quantified residual α-helices, β-strands, PPII, and unordered structures across different denaturation conditions, revealing that even fully unfolded proteins retain structured elements. This computational approach allowed detailed characterization of protein ensembles from experimental CD data [27].
Nagy et al., 2019 developed a computational method to predict protein CD spectra from structural models using secondary structure composition and precalculated basis spectra. The approach improves model validation, outperforms DichroCalc and PDB2CD, and accurately predicts spectra for most globular proteins. Accounting for intensity normalization, side chains, and structural flexibility further enhances predictions for challenging cases, including short peptides and intrinsically disordered proteins [28].
Karabencheva-Christova et al., 2013 used multilevel computational methods, including molecular dynamics, semiempirical quantum mechanics, and time-dependent density functional theory to investigate the near-UV CD spectra of human carbonic anhydrase II and its tryptophan mutants. Comparing computed spectra with experiments, they showed that combining CD calculations, crystal structures, and MD simulations improves agreement and provides insights into how protein conformational flexibility influences aromatic chromophore interactions [29].
Gekko, 2019 reviews the use of synchrotron-radiation vacuum-ultraviolet circular dichroism (VUVCD) spectroscopy in structural biology. VUVCD extends CD measurements to ~160 nm, providing detailed structural insights into biomolecules. It reveals hydrogen-bonding effects in saccharides, hydration-dependent dihedral fluctuations in amino acids, and improves predictions of protein secondary structure and sequence when combined with bioinformatics. VUVCD also clarifies base composition and sequence effects in nucleic acids, making it a powerful tool for studying native, nonnative, and membrane-bound biomolecules [30].
Nagy et al., 2024 provide a reference dataset of intrinsically disordered proteins (IDPs) with matching circular dichroism (CD) spectra to evaluate computational prediction methods. Most tools show lower accuracy for IDPs compared to globular proteins, whereas Secondary Structure Estimation from Circular dichroism Analysis (SESCA) performs well for both. This dataset enables improved CD analysis for disordered proteins [31].
Park et al., 2015 present a computational strategy with CD to precisely control the shape of repeat-protein scaffolds, focusing on leucine-rich-repeat proteins. The method involves designing self-compatible building blocks to create surfaces with defined curvatures, developing junction modules to connect them, and assembling new proteins with customized shapes. Crystal structures of the designed proteins demonstrate the effectiveness of this approach in controlling repeat-protein curvature [32].
Application of circular dichroism spectroscopy
The table 1 highlights the main applications of circular dichroism (CD) spectroscopy in protein research, emphasizing the structural information it provides along with corresponding literature references. CD is commonly employed to determine protein secondary structure, track conformational changes and stability, study intrinsically disordered proteins (IDPs), and verify the structural consistency of recombinant proteins and biopharmaceuticals. By comparing CD spectra with reference data, researchers can efficiently assess protein folding, stability, disorder, and overall structural integrity using minimal sample quantities.
Table 1: Applications of circular dichroism spectroscopy
| Application | Circular dichroism spectroscopy outcomes | References |
| Secondary structure estimation | In the far‑UV (190–250 nm), α‑helices show negative peaks at 208 and 222 nm, β‑sheets around 218 nm, and random coils have distinct patterns. Comparing spectra with references allows estimation of α‑helix, β‑sheet, and coil content. | [33] |
| Conformational changes/stability | CD, performed in solution with minimal sample, is ideal for monitoring structural changes—such as folding/unfolding, conformational shifts, or stability under varying conditions or upon ligand/partner binding. | [34] |
| Intrinsically disordered proteins (IDPs) | CD helps assess disorder content, conformational ensembles, or disorder-to-order transitions. | [20] |
| Quality control/biopharmaceuticals | Ensures structural consistency in recombinant proteins and biosimilars. | [21] |
Advantages and limitations of circular dichroism spectroscopy in protein structure prediction
Table 2 shows Advantages and Limitations of Circular Dichroism Spectroscopy in Protein structure prediction. Circular dichroism (CD) spectroscopy provides rapid, non-destructive analysis of protein secondary structure and stability, useful for folding studies and proteins difficult to crystallize. It cannot determine tertiary/quaternary structure, gives approximate secondary structure, and requires pure samples for reliable results [2, 36, 37].
Table 2: Advantages and limitations of circular dichroism spectroscopy in protein structure prediction
| Aspect | Advantages | Limitations | References |
| Structural information | Provides semi-quantitative estimation of secondary structure (α-helix, β-sheet, coil). Monitors folding/unfolding, stability, ligand binding. Useful for proteins difficult to crystallize or intrinsically disordered. |
Cannot resolve tertiary or quaternary structure. Secondary structure estimation approximate, especially for mixed or non-canonical folds. No site-specific information. |
[2] |
| Screening and complementary tool | Rapid screening for stability under varying conditions (pH, temperature, ligands). Complements computational predictions and other structural methods. |
Dependent on reference datasets and algorithms; limited accuracy for unusual folds. Averaged data; heterogeneous samples (aggregates, oligomers) are hard to interpret. |
[36]. |
| Sample use | Non-destructive, requires small amounts of protein. Rapid data collection; suitable for screening. -Works in solution; no crystallization needed. |
Requires high purity; buffers or contaminants can interfere. Sensitive to experimental conditions (temperature, path length, concentration). |
[2, 37] |
CONCLUSION
Circular dichroism (CD) spectroscopy is a rapid, versatile, and non-destructive method for probing protein secondary structure, folding, stability, and conformational changes. Far-UV CD provides semi-quantitative estimation of α-helices, β-sheets, and random coils, while near-UV and vibrational CD reveal tertiary environments and molecular chirality. CD requires minimal sample amounts, works in solution, and complements computational analyses, enabling insights into complex proteins, intrinsically disordered proteins, and protein-ligand interactions. Its applications span structural biology, drug discovery, protein engineering, and quality control of biopharmaceuticals.
Despite its advantages, CD spectroscopy has limitations: it cannot resolve tertiary or quaternary structures, provides approximate secondary structure estimates, and relies on high-purity samples and reference datasets. Future research should focus on improving computational prediction accuracy, developing standardized reference databases, and expanding CD applications to study dynamic protein complexes, membrane proteins, and challenging biomolecular systems. Integrating CD with emerging techniques like machine learning, synchrotron radiation CD, and multi-modal spectroscopy will enhance structural insights, making it an even more powerful tool for protein science and biotechnology.
ACKNOWLEDGEMENT
The author would like to acknowledge the valuable contributions of fellow researchers, whose work is cited in the references section, for their insightful publications that have informed and enriched this review paper. The table made by the author themselves doesn’t copy from any sources.
FUNDING
Not applicable
AUTHORS CONTRIBUTIONS
Manuscript prepared by Ashish Uzgare. Fig. and table made by author themselves doesn’t copy from any sources.
CONFLICT OF INTERESTS
Author declare no conflict of interest.
REFERENCES
Rehan SF, Sambhajib UA. Efficient protein purification: from basics to advanced analytical techniques a review. Anal Bioanal Chem Res. 2025;13(1):133-46. doi: 10.22036/abcr.2025.545961.2420.
Greenfield NJ. Using circular dichroism spectra to estimate protein secondary structure. Nat Protoc. 2006;1(6):2876-90. doi: 10.1038/nprot.2006.202, PMID 17406547.
Rodger A, Marshall D. Beginners guide to circular dichroism. Biochemist. 2021;43(2):58-64. doi: 10.1042/bio_2020_105.
Miles AJ, Janes RW, Wallace BA. Tools and methods for circular dichroism spectroscopy of proteins: a tutorial review. Chem Soc Rev. 2021;50(15):8400-13. doi: 10.1039/d0cs00558d, PMID 34132259.
Kelly SM, Jess TJ, Price NC. How to study proteins by circular dichroism. Biochim Biophys Acta. 2005;1751(2):119-39. doi: 10.1016/j.bbapap.2005.06.005, PMID 16027053.
Nakanishi K, Berova N, Woody R. Circular dichroism: principles and applications. VCH; 1994.
Solomon EI, Lever AB. Inorganic electronic structure and spectroscopy. Wiley Interscience; 2006.
Sreerama N, Woody RW. Computation and analysis of protein circular dichroism spectra. Methods Enzymol. 2004;383:318-51. doi: 10.1016/S0076-6879(04)83013-1, PMID 15063656.
Andrews SS, Tretton J. Physical principles of circular dichroism. J Chem Educ. 2020;97(12):4370-6. doi: 10.1021/acs.jchemed.0c01061.
Kondo Y. Principles and applications of CD spectroscopy. J Syn Org Chem Japan. 2017;75(5):557-63. doi: 10.5059/yukigoseikyokaishi.75.557.
Fasman GD, editor. Circular dichroism and the conformational analysis of biomolecules. Plenum Press; 1996.
Oyama T, Suzuki S, Akao KI. Circular dichroism spectroscopy in protein engineering and pharmaceutical development: applications in structural characterization and quality assessment. Protein Expr Purif. 2025;237:106826. doi: 10.1016/j.pep.2025.106826, PMID 41067399.
Linhares LA, Ramos CH. Unlocking insights into folding structure and function of proteins through circular dichroism spectroscopy a short review. Appl Biosci. 2023;2(4):639-55. doi: 10.3390/applbiosci2040040.
Sun X, Cao E, Bai C, He Y, Qin J. Circular dichroism spectra of different structures formed by the oligonucleotides. Chinese Science Bulletin. 1998;43(17):1456-60. doi: 10.1007/BF02884124.
Keiderling TA, Wang B, Urbanova M, Pancoska P, Dukor RK. Empirical studies of protein secondary structure by vibrational circular dichroism and related techniques: α-lactalbumin and lysozyme as examples. Faraday Discuss. 1994;(99):263-85. doi: 10.1039/fd9949900263, PMID 7549541.
Datta D, J Swamy M. Fluorescence and circular dichroism studies on the accessibility of tryptophan residues and unfolding of a jacalin-related α-d-galactose-specific lectin from mulberry (Morus indica). J Photochem Photobiol B. 2017;170:108-17. doi: 10.1016/j.jphotobiol.2017.03.026, PMID 28414980.
Sangeeta PAR, Pathania AR. Circular dichroism and its uses in biomolecular research a review. E3S Web Conf. 2021;309:01229. doi: 10.1051/e3sconf/202130901229.
Honisch C, Donadello V, Hussain R, Peterle D, De Filippis V, Arrigoni G. Application of circular dichroism and fluorescence spectroscopies to assess photostability of water-soluble porcine lens proteins. ACS Omega. 2020;5(8):4293-301. doi: 10.1021/acsomega.9b04234, PMID 32149259.
Hall V, Sklepari M, Rodger A. Protein secondary structure prediction from circular dichroism spectra using a self-organizing map with concentration correction. Chirality. 2014;26(9):471-82. doi: 10.1002/chir.22338, PMID 24890763.
Micsonai A, Wien F, Kernya L, Lee YH, Goto Y, Refregiers M. Accurate secondary structure prediction and fold recognition for circular dichroism spectroscopy. Proc Natl Acad Sci USA. 2015;112(24):E3095-103. doi: 10.1073/pnas.1500851112, PMID 26038575.
Eikas KD, Beerepoot MT, Ruud K. A computational protocol for vibrational circular dichroism spectra of cyclic oligopeptides. J Phys Chem A. 2022;126(32):5458-71. doi: 10.1021/acs.jpca.2c02953, PMID 35930395.
Rogers DM, Do H, Hirst JD. Electronic circular dichroism of proteins computed using a Diabatisation scheme. Mol Phys. 2022;121(7-8):e2133748. doi: 10.1080/00268976.2022.2133748.
Uporov IV, Forlemu NY, Nori R, Aleksandrov T, Sango BA, Mbote YE. Introducing DInaMo: a package for calculating protein circular dichroism using classical electromagnetic theory. Int J Mol Sci. 2015;16(9):21237-76. doi: 10.3390/ijms160921237, PMID 26370961.
Jasim SB, Li Z, Guest EE, Hirst JD. DichroCalc: improvements in computing protein circular dichroism spectroscopy in the near-ultraviolet. J Mol Biol. 2018;430(15):2196-202. doi: 10.1016/j.jmb.2017.12.009, PMID 29258819.
Janes RW. Bioinformatics analyses of circular dichroism protein reference databases. Bioinformatics. 2005;21(23):4230-8. doi: 10.1093/bioinformatics/bti690, PMID 16188926.
Zhao L, Zhang J, Zhang Y, Ye S, Zhang G, Chen X. Accurate machine learning prediction of protein circular dichroism spectra with embedded density descriptors. JACS Au. 2021;1(12):2377-84. doi: 10.1021/jacsau.1c00449, PMID 34977905.
Matsuo K, Sakurada Y, Yonehara R, Kataoka M, Gekko K. Secondary structure analysis of denatured proteins by vacuum-ultraviolet circular dichroism spectroscopy. Biophys J. 2007;92(11):4088-96. doi: 10.1529/biophysj.106.103515, PMID 17369421.
Nagy G, Igaev M, Jones NC, Hoffmann SV, Grubmuller H. SESCA: predicting circular dichroism spectra from protein molecular structures. J Chem Theor Comput. 2019;15(9):5087-102. doi: 10.1021/acs.jctc.9b00203, PMID 31402660.
Karabencheva Christova TG, Carlsson U, Balali Mood K, Black GW, Christov CZ. Conformational effects on the circular dichroism of human carbonic anhydrase II: a multilevel computational study. PLOS One. 2013;8(2):e56874. doi: 10.1371/journal.pone.0056874, PMID 23526922.
Gekko K. Synchrotron-radiation vacuum-ultraviolet circular dichroism spectroscopy in structural biology: an overview. Biophys Physicobiol. 2019;16:41-58. doi: 10.2142/biophysico.16.0_41, PMID 30923662.
Nagy G, Hoffmann SV, Jones NC, Grubmuller H. Reference data set for circular dichroism spectroscopy comprised of validated intrinsically disordered protein models. Appl Spectrosc. 2024;78(9):897-911. doi: 10.1177/00037028241239977, PMID 38646777.
Park K, Shen BW, Parmeggiani F, Huang PS, Stoddard BL, Baker D. Control of repeat-protein curvature by computational protein design. Nat Struct Mol Biol. 2015;22(2):167-74. doi: 10.1038/nsmb.2938, PMID 25580576.
Whitmore L, Wallace BA. Protein secondary structure analyses from circular dichroism spectroscopy: methods and reference databases. Biopolymers. 2008;89(5):392-400. doi: 10.1002/bip.20853, PMID 17896349.
Wallace BA. Protein characterisation by synchrotron radiation circular dichroism spectroscopy. Q Rev Biophys. 2009;42(4):317-70. doi: 10.1017/s003358351000003x, PMID 20450533.
Wallace BA, Janes RW. Applications of circular dichroism to studies of protein structure and folding. Curr Opin Chem Biol. 2001;5(5):567-71. doi: 10.1016/s1367-5931(00)00243-8.
Lees JG, Janes RW. Combining sequence-based prediction methods and circular dichroism and infrared spectroscopic data to improve protein secondary structure determinations. BMC Bioinform. 2008;9:24. doi: 10.1186/1471-2105-9-24, PMID 18197968.
Khrapunov S. Circular dichroism spectroscopy has intrinsic limitations for protein secondary structure analysis. Anal Biochem. 2009;389(2):174-6. doi: 10.1016/j.ab.2009.03.036, PMID 19332020.