
Int J Chem Res, Vol 4, Issue 4, 9-16Research Article
STABILITY-INDICATING METHOD DEVELOPMENT AND VALIDATION FOR THE ESTIMATION OF ROSUVASTATIN CALCIUM IN PHARMACEUTICAL DOSAGE FORM BY REVERSE PHASE-HIGH PERFORMANCE LIQUID CHROMATOGRAPHY
AWDHUT PIMPALE, RAJENDRA KAKDE*
Department of Pharmaceutical Sciences, R. T. M. Nagpur University, Amravati Road, Nagpur 440033, Maharashtra, India
Email: [email protected]
Received: 04 May 2020 Revised and Accepted: 05 Aug 2020
ABSTRACT
Objective: The present work was focused on the development and validation of the reversed-phase high-performance liquid chromatography (RP-HPLC) method, which is simple, rapid, precise, accurate, sensitive, economical, and stability-indicating for the quantification of rosuvastatin calcium in bulk and tablet formulation.
Methods: The separation was attained on reversed-phase Princeton (C18) column with dimensions (250 mm × 4.6 mm, 5μ) employing buffer, which is a mixture of water (pH 3.0, adjusted with orthophosphoric acid) and methanol in the ratio (20:80) v/v as mobile phase, at flow rate 1.0 ml/min. and detection was carried out at wavelength 240 nm. The retention time under the optimized condition of rosuvastatin calcium was found to be 2.844 min.
Results: The linearity of the method was demonstrated in the concentration range of 6-16 µg/ml for rosuvastatin calcium with a correlation coefficient (r2) of 0.9999. The percentage relative standard deviation was ˂2% and percentage recovery was found to be 100.12-101.37% for rosuvastatin calcium. The assay of marketed tablet formulations was found to be 98.99%.
Conclusion: The developed RP-HPLC technique was found to be simple, specific, sensitive, rapid, linear, accurate, precise, and economical and will be used for regular quality control of rosuvastatin calcium in bulk and tablet formulations.
Keywords: Rosuvastatin calcium, RP-HPLC, Validation, ICH guidelines
© 2020 The Authors. Published by Innovare Academic Sciences Pvt Ltd. This is an open access article under the CC BY license (http://creativecommons.org/licenses/by/4.0/)
DOI: http://dx.doi.org/10.22159/ijcr.2020v4i4.128. Journal homepage: https://ijcr.info/index.php/journal
INTRODUCTION
Rosuvastatin calcium (RSV), is chemically (3R, 5R)-7-[4-(4-Fluorophenyl)-2-[methyl(methylsulfonyl)amino]-6-propan-2-ylpyrimidin-5-yl]-3,5-dihydroxyhept-6enoic acid (fig. 1). It is an HMG-CoA reductase inhibitor used in the treatment of hypertension, abnormal lipid [1, 2]. An extensive literature survey revealed that several HPLC methods were reported for the estimation of rosuvastatin calcium in bulk and tablet formulation [3-21]. The International Conference on Harmonization (ICH) guideline entitled “Stability testing of new drug substances and products” requires that stress testing be administered to elucidate the inherent stability characteristics of the active substance [22]. An ideal stability-indicating technique is one that resolves the drug and its degradation products efficiently. Consequently, the implementation of an analytical methodology to determine RSV in the presence of its degradation products is sort of a challenge for pharmaceutical analysts. Therefore, it was thought necessary to study the stability of RSV under acidic, alkaline, hydrolytic, oxidative, light, and thermal conditions. This paper reports validated stability-indicating reverse phase HPLC method for the simultaneous determination of RSV in the presence of their degradation products. The proposed method is simple, accurate, reproducible, stability-indicating, and suitable for routine determination of RSV in bulk and tablet formulations. The method was validated in compliance with ICH guidelines.
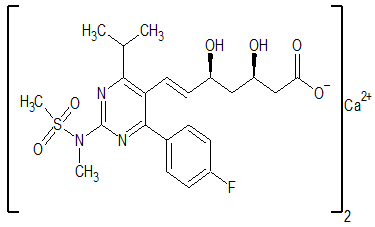
Fig. 1: Chemical structure of rosuvastatin calcium (RSV)
MATERIALS AND METHODS
Chemicals and reagents
Pharmaceutical grade Rosuvastatin calcium was procured as a gift sample from Cadila Pharmaceuticals Ltd., Ahmedabad (India), Rosmi 10 a tablet formulation, obtained commercially.
Methanol, ortho-phosphoric acid, hydrochloric acid, sodium hydroxide, and hydrogen peroxide 30% of analytical grade were used throughout the work.
Instrumentation
The analysis was performed using reversed-phase high-performance liquid chromatography (RP-HPLC) Shimadzu LC-6AD system equipped with a PDA detector with Lab Solution software were used.
Chromatographic Conditions
Chromatographic separation was achieved on a reversed-phase Princeton (C18) column with dimensions (250 mm × 4.6 mm, 5μ) at ambient temperature using a mobile phase consisting of a mixture of buffer (pH 3.0, adjusted with orthophosphoric acid) and methanol in the ratio of (20:80) v/v at a flow rate of 1.0 ml/min. Detection was carried out at 240 nm. The pH of the mobile phase was set at 3.0; Injection volume was 10 μl. The optimized chromatographic condition is shown in table 1.
Table 1: Optimized chromatographic condition
| Chromatographic condition | |
| Mobile phase | Water (pH adjusted to 3.0 with ortho phosphoric acid): |
| Methanol (20:80) v/v | |
| Flow rate | 1.0 ml/min. |
| Column | Princeton C18 (250 mm × 4.6 mm, 5μ) |
| Detector wavelength | 240 nm |
| Column temperature | 30 °C |
| Injection volume | 10 µl |
| Runtime | 20 min |
| Diluent | Methanol |
| Retention time | 2.844 min |
Preparation of standard solution of RSV
For RSV, an accurately weighed 1.0 mg of RSV was transferred to a 10.0 ml volumetric flask and dissolved in 5.0 ml of methanol. The volume was completed to 10.0 ml with methanol. One milliliter of the resulting solution was pipetted in 10.0 ml volumetric flask and the volume was made up to 10.0 ml with methanol to furnish a solution of concentration 10 μg/ml of RSV.
Preparation of sample solution of RSV
Twenty tablets were weighed and finely powdered. An accurately weighed amount of powder equivalent to 1.0 mg of RSV was transferred into a 10.0 ml volumetric flask. Then 5.0 ml of methanol was added in it. The flask contents were sonicated for 10 min to make the contents homogeneous. This solution was then diluted up to the mark with methanol. The resultant solution was filtered through Whatman Grade I filter paper. One milliliter of the filtrate was transferred to a 10 ml volumetric flask and then the volume was made up to the mark with methanol to furnish a sample solution containing 10 μg/ml of RSV. Six replicate of tablet powder equivalent to 1.0 mg of RSV was transferred into six 10.0 ml volumetric flask and homogenous sample solutions were prepared similarly.
Method validation
The developed method was validated following ICH guidelines (ICH Q2R1) for accuracy, precision, specificity, linearity, limit of detection (LOD), the limit of quantification (LOQ), robustness [23].
Accuracy
The accuracy of an analytical procedure expresses the closeness of agreement between the value, which is accepted either as a standard true value or an accepted reference value, and therefore, the value found. It was computed at three different levels, i.e., 80, 100, and 120% of the label claim. Standard addition and recovery experiments were conducted to determine the accuracy of RSV for the quantification of drugs in the sample.
Precision
The system precision was evaluated by measuring the area of six qualified working standards for RSV and calculating the percentage of relative standard deviation (RSD). The assay method precision was evaluated by conducting six independent assays of test samples of RSV against qualified working standards and calculating the percentage of relative standard deviation (RSD). The intermediate precision of the method was also verified using different analysts and different days.
Linearity
Linearity test solutions of RSV were prepared at concentration levels of 6-16 µg/ml. Linearity test solutions were prepared by diluting the stock solution to the required concentrations. Linearity was established by the least-squares linear regression analysis of the calibration data. Peak areas were plotted against the respective concentrations and linear regression analysis performed on the resulting curves. The linear curve of rosuvastatin calcium was shown in fig. 2.
Specificity
The specificity of the developed method was established by comparing the chromatograph of the standard and sample. It was found that there was no interference due to excipients and impurities at the retention time of the drug.
LOD and LOQ
The LOD is the lowest analyte concentration that can be detected. LOQ is the lowest analyte concentration that can be quantified with acceptable accuracy and precision. The limits of detection (LOD) and quantification (LOQ) were calculated from the standard deviation of the response and the slope of the calibration plot. LOD and LOQ were established, under ICH definitions, by use of the equations LOD = 3.3σ/S and LOQ = 10σ/S, where σ is the standard deviation of the regression line and S is the slope of the calibration plot.
Robustness
To evaluate the robustness of the developed method, the chromatographic conditions were deliberately altered and the resolution for RSV was evaluated. To study the effect of wavelength on the estimation, the wavelength was altered by±2 nm, i.e., 238 and 242 nm from the actual wavelength, 240 nm. To study the effect of flow rate on estimation, the flow rate was altered by±0.1 ml/min i.e., 0.9 and 1.1 ml/min from the actual flow rate, 1.0 ml/min.
Stability of the solution
The stability of both the standard and sample solutions was checked up to 24 hr. at room temperature.
Stability-indicating assay
The drug was subjected to acidic (0.1N HCl), alkaline (0.1N NaOH), oxidative (0.3% H2O2), photo (UV light), thermal (sand bath at 50 °C), and hydrolytic (water) condition and the percentage degradation were calculated.
RESULTS AND DISCUSSION
HPLC method development and optimization
In this work, the analytical HPLC method was used for the determination of degraded products, which was developed and validated. Initially, pure drugs solution was chromatographed using a mobile phase consisting of a mixture of buffer (pH 3.0, adjusted with orthophosphoric acid) and methanol in the ratio of (20:80) v/v at a flow rate of 1.0 ml/min. gives well-resolved peaks of drugs as well. Detection was carried out at 240 nm. The retention time under the optimized condition of rosuvastatin calcium was found to be 2.844 min. The total run time of the chromatogram was about 20 min. A typical chromatography of standard and sample of rosuvastatin calcium is shown in fig. 3 and fig. 4, respectively.
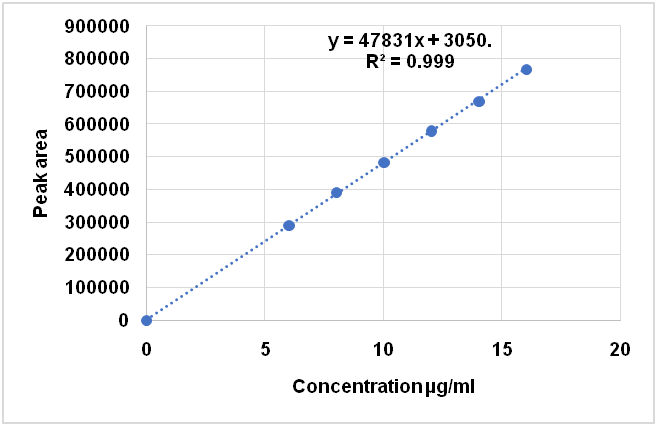
Fig. 2: Linear curve of rosuvastatin calcium (RSV)
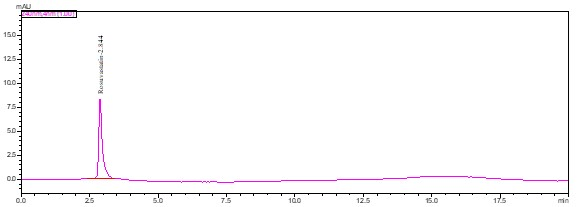
Fig. 3: A typical chromatograph of standard rosuvastatin calcium (RSV)
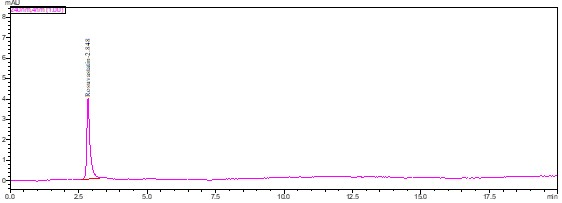
Fig. 4: A typical chromatograph of sample rosuvastatin calcium (RSV)
Validation of the method
System suitability
The suitability of the system was demonstrated by assessing various parameters. It was established by injecting six replicate injections of the standard solution. Theoretical plates were found to be 2816, tailing factor of 1.60, and %RSD of peak area was 0.9 for RSV (table 2). All the system suitability parameters were well within limits, indicating that the system was well suitable for performing the analysis.
Table 2: System suitability results
| Parameter | RSV |
| Theoretical Plate | 2816 |
| Retention Time (Rt) | 2.844 |
| Tailing Factor | 1.60 |
| % RSD | 0.9 |
Rt: Retention time, %RSD: Percentage relative standard deviation
Linearity
Linearity was established by the least-squares linear regression analysis of the calibration data. Calibration plots were linear over the concentration range of 6-16 µg/ml for RSV. Peak areas were plotted against the respective concentrations, and linear regression analysis performed on the resulting curves. Equation for the calibration plots of RSV was Y = 47831x+3050.8 with correlation coefficient 0.9999. The results of linearity are shown in table 3.
Table 3: Linearity results
| Parameter | RSV |
| Concentration Range (µg/ml) | 6-16 |
| Slope (m) | 47831 |
| Tailing factor | 3050.8 |
| Coefficient correlation (r2) | 0.99999 |
Accuracy
The percentage of recoveries was 100.12-101.37% for RSV. The %RSD value was found to be ˂2%. The results of recovery are shown in table 4.
Table 4: Recovery results
| Level (%) | Amount taken (µg/ml) | Amount found* | % Recovery* (µg/ml) |
| 80 | 8 | 8.11 | 101.37 |
| 100 | 10 | 10.01 | 100.12 |
| 120 | 12 | 12.05 | 100.41 |
*Average of three determinations
Precision
The precision of the method for the determination of RSV was studied using the parameters i.e. system precision, method precision, and intermediate precision. The system precision was determined by six replicate injections of standard solution injected into the HPLC system. The relative standard deviation was less than 2%. Method precision was determined by the six individuals sample preparations injected into the HPLC system. The relative standard deviation was less than 2%. The result of intraday and interday for RSV was 0.9 and 0.6, respectively. The percentage RSD of system, method, and intermediate precision study was well within±2.0%, indicate that the method was precise.
LOD and LOQ
The LOD and LOQ of RSV were 0.65 µg/ml and 1.98 µg/ml, respectively.
Robustness
The robustness of the method was designed by changing the optimized condition adequately. To evaluate the robustness of the developed method, the chromatographic conditions were deliberately altered and the resolution for RSV was evaluated. On the assessment of the result, it can be deduced that the variation in the changing wavelength, the flow rate does not affect the method significantly. %RSD<2% specifies that the developed method was robust. The results of robustness are shown in table 5.
Table 5: Robustness results
| Condition | RSV | ||
| Amount Estimated* [%] | RSD [%] | ||
| Change in wavelength (240±2 nm) |
238 nm 242 nm |
97.28 98.21 |
0.5698 0.5733 |
Change in flow rate (1.0±0.1 ml/min) |
0.9 ml/min 1.1 ml/min |
99.55 99.24 |
0.6381 0.5078 |
*Average of three determinations, %RSD: Percentage relative standard deviation
The percentage assay of tablet formulation was found to be 98.99 for RSV. Forced degradation studies were performed by subjecting to the different stress conditions like acidic, alkaline, hydrolytic, oxidative, thermal, photolytic. From the chromatograms of stressed samples, it was found that no interference from degradants was observed at the retention time of RSV. Major degradation was observed in acidic conditions with 2 degraded samples at Rt values 1.784, 2.146 with percentage areas 9.29%, in alkaline condition with the degraded sample at Rt values 2.515 with percentage areas 8.72%. Substantial degradation was observed in hydrolytic conditions with the degraded samples at Rt values 2.142 with percentage areas 6.16%, in oxidative condition with 2 degraded samples at Rt values 1.122, 2.518 with percentage areas 7.82%, in light condition with the degraded sample at Rt values 2.212 with percentage areas 4.45%. No degradation was observed in the presence of heat for RSV. The results of the percentage of degradation are presented in table 6 and fig. 5-10.
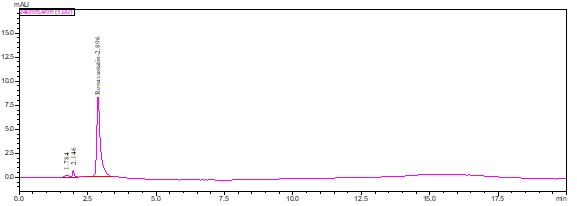
Fig. 5: A typical chromatogram of RSV degraded with acid hydrolysis
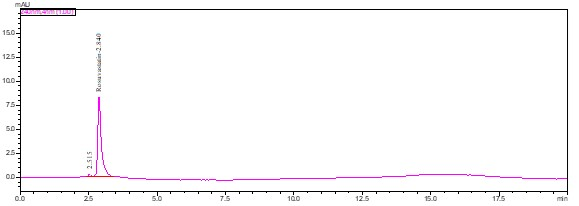
Fig. 6: A typical chromatogram of RSV degraded with alkali hydrolysis
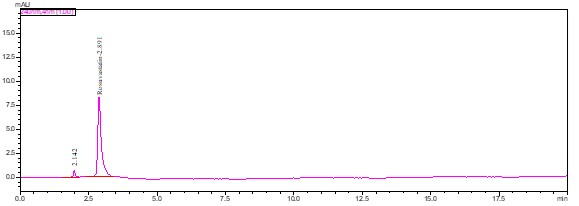
Fig. 7: A typical chromatogram of RSV degraded with neutral hydrolysis
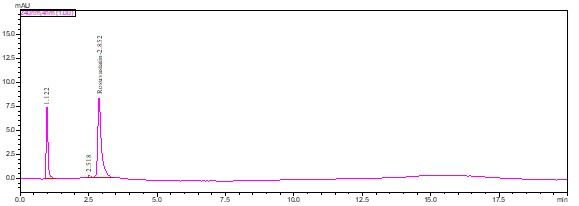
Fig. 8: A typical chromatogram of RSV degraded with oxidative hydrolysis
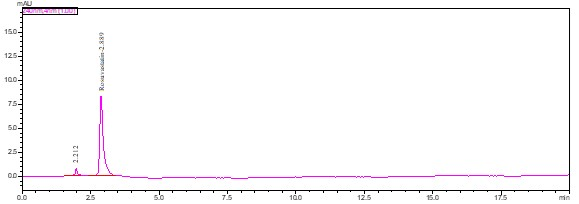
Fig. 9: A typical chromatogram of RSV degraded with exposed to direct sunlight
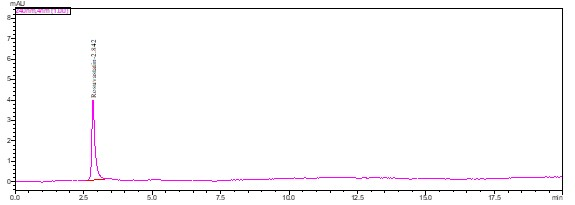
Fig. 10: A typical chromatogram of RSV degraded with thermal hydrolysis
Table 6: Stability-indicating method data for RSV
| Stress condition | RSV |
| Acidic (0.1N HCl for 24 h) | 9.29 |
| Alkaline (0.1N NaOH for 24 h) | 8.72 |
| Hydrolytic (HPLC waters for 24 h) | 6.16 |
| Oxidative (0.3% H2O2 for 24 h) | 7.82 |
| Photo (Sunlight for 30 d) | 4.45 |
| Thermal (Sand bath at 50 °C for 24 h) | No degradation |
HPLC: High-Performance Liquid Chromatography
Table 7: Summary of validation parameter
| Parameter | RSV |
| Calibration range (µg/ml) | 6-16 |
| Optimized wavelength (nm) | 240 |
| Retention Time | 2.844 |
| Regression equation (Y) | Y = 47831x+3050.8 |
| Slope | 47831 |
| Intercept | 3050.8 |
| Coefficient correlation (r2) | 0.9999 |
| Precision (% RSD) | |
| Intraday | 0.9 |
| Interday | 0.6 |
| % Assay* | 98.99 |
| LOD (µg/ml) | 0.65 |
| LOQ (µg/ml) | 1.98 |
*Average of five determinations, LOD: Limit of detection, LOQ: Limit of quantification
CONCLUSION
The method enables simple, rapid, accurate, precise, specific, economical, and sensitive analysis of rosuvastatin calcium in bulk and tablet dosage form. This method was validated as per ICH guidelines. The method can, therefore, be used for routine quality-control analysis rosuvastatin calcium in bulk and tablet dosage form.
ACKNOWLEDGMENT
The authors extend their sincere thanks to Cadila Pharmaceuticals Ltd, Ahmadabad (India), for providing a gift sample of pure rosuvastatin calcium. We also extend our thanks to the Head of Department, Department of Pharmaceutical Sciences, RTM Nagpur University, Nagpur for providing the necessary facilities.
FUNDING
Nil
AUTHORS CONTRIBUTIONS
AP and RK designed the study. AP performed the experiment and analyzed the data and reviewed it. RK supervised the experiment, reviewed the data, and supported for writing the manuscript.
CONFLICT OF INTERESTS
Authors declare that they have no conflict of interest exists in this investigation.
REFERENCES
https://en.wikipedia.org/wiki/rosuvastatin [Last accessed on 01 Apr 2020]
The United States Pharmacopeia 29; National Formulary 24, U. S. Pharmacopeal Convention; 2007. p. 1280.
Rajput P, Shah DB, Maheshwari DG. A review on the chromatographic method for the estimation of rosuvastatin calcium. Int J Res Pharm Pharm Sci 2018;3:28-31.
Kumar TR, Shitut NR, Kumar PK. Determination of rosuvastatin in rat plasma by HPLC: validation and its application to pharmacokinetic studies. Biomed Chromatogr 2006;20:881‐7.
Hassouna ME, Salem HO. Stability indicating a new RP-HPLC method for the determination of rosuvastatin calcium in pure and tablets dosage forms. Int J Appl Pharm Biol Res 2017;2:11-27.
Sirisha Mulukuri NV, Srinivasarao T, Raveendra BG. New RP-HPLC method development and validation for the estimation of rosuvastatin calcium in bulk drugs and formulations. J Pharm Res 2017;11:257-60.
Sailaja B, Sravan Kumari K. Stability-indicating method development and validation for the estimation of rosuvastatin calcium in bulk and tablet formulation by reverse-phase high-performance liquid chromatography. Asian J Pharm Clin Res 2019;12:251-6.
Hasumati AR, Rajput SJ, Dave JB, Patel CN. Development and validation of two chromatographic stability-indicating methods for the determination of rosuvastatin in pure from and pharmaceutical preparation. Int J Chem Tech Res 2009;1:677-89.
Harshal Kanubhai Trivedi, Mukesh C Patel. Development and validation of a stability-indicating RP-UPLC method for the determination of rosuvastatin and related substances in the pharmaceutical dosage form. Sci Pharm 2012;80:393-406.
Singh SS, Sharma K, Patel H, Jain M, Shah H, Gupta S. Estimation of rosuvastatin in human plasma by HPLC tandem mass spectroscopic method and its application to a bioequivalence study. J Braz Chem Soc 2005;16:944-50.
Dujuan Z, Jing Z, Xiaoyan L, Chunmin W, Rui Z, Haojing S, et al. Validated LCMS/MS method for the determination of rosuvastatin in human plasma: application to a bioequivalence study in Chinese volunteers. Pharmacol Pharm 2011;2:341-6.
Bahrami G, Mohammadi B, Mirzaeei S, Kiani A. Determination of atorvastatin in human serum by reversed-phase high-performance liquid chromatography with UV detection. J Chromatography B 2005;826:41-5.
Sailaja B, Sravan Kumari K. Stability-indicating method development and validation for the estimation of rosuvastatin calcium in bulk and tablet formulation by reverse-phase high-performance liquid chromatography. Asian J Pharm Clin Res 2019;12:251-6.
Damle MC, Waghmare SS, Sinha P. Development and validation of stability-indicating HPTLC method for determination of apixaban as bulk drug. Int J Pharm Pharm Sci 2019;11:37-42.
Pathan M, Kshirsagar A. Development of validated stability-indicating method by RP-HPLC for simultaneous estimation of meropenem and vaborbactam in bulk and pharmaceutical formulation. Int J Pharm Pharm Sci 2019;11:102-8.
RR, J, Jerin James. A validated RP-HPLC method for simultaneous estimation of pyrantel pamoate and praziquantel in the bulk and pharmaceutical dosage form. Int J Pharm Pharm Sci 2019;11:62-7.
Malak Y, Al-Bathish, Azza A Gazy, Marwa K, El-Jamal. RP-HPLC and chemometric methods for the determination of two anti-diabetic mixtures; metformin hydrochloride-canagliflozin and metformin hydrochloride-gliclazide in their pharmaceutical formulation. Int J Pharm Pharm Sci 2020;12:83-94.
Aher SS, Saudagar RB, Kothari H. Development and validation of RP-HPLC method for simultaneous estimation of azilsartan medoxomil and chlorthalidone in bulk and tablet dosage form. Int J Curr Pharm Res 2018;10:21-4.
Choppella V, Badipati S, Gonthina H, Chukka VK. Stability indicating method development and validation for simultaneous quantification of sorafenib and regorafenib drug substances by using RP-UPLC. Int J Curr Pharm Res 2020;12:56-62.
Chengalva P, Kuchana M. Stability indicating UPLC method for simultaneous determination of phenylephrine hydrochloride, chlorpheniramine maleate, paracetamol, guaiphenesin and bromhexine hydrochloride in bulk and pharmaceutical formulation. Int J Appl Pharm 2019;11:284-92.
Kuchana M, Kandukuru C, Chengalva P. Development and validation of RP-HPLC method for simultaneous estimation of ciprofloxacin and fluocinolone acetonide in bulk and pharmaceutical dosage form. Int J Appl Pharm 2020;12:134-8.
ICH, Q1A. Stability testing of new drug substances and products. In: Proceedings of the International Conference on Harmonisation, Geneva, October; 1993.
https://www.ich.org/fileadmin/Public_Web_Site/ICH_ Products/Guidelines/Quality/Q2_R1/Step4/Q2_R1__Guideline.pdf. [Last accessed on 01 Apr 2020].